Income Scoring
In this example, we’ll walk through an example of using the Posit toolchain for a data science project using US census data from the UCI Machine Learning Repository. The notebooks, app, and API in this example have all been published to Connect.
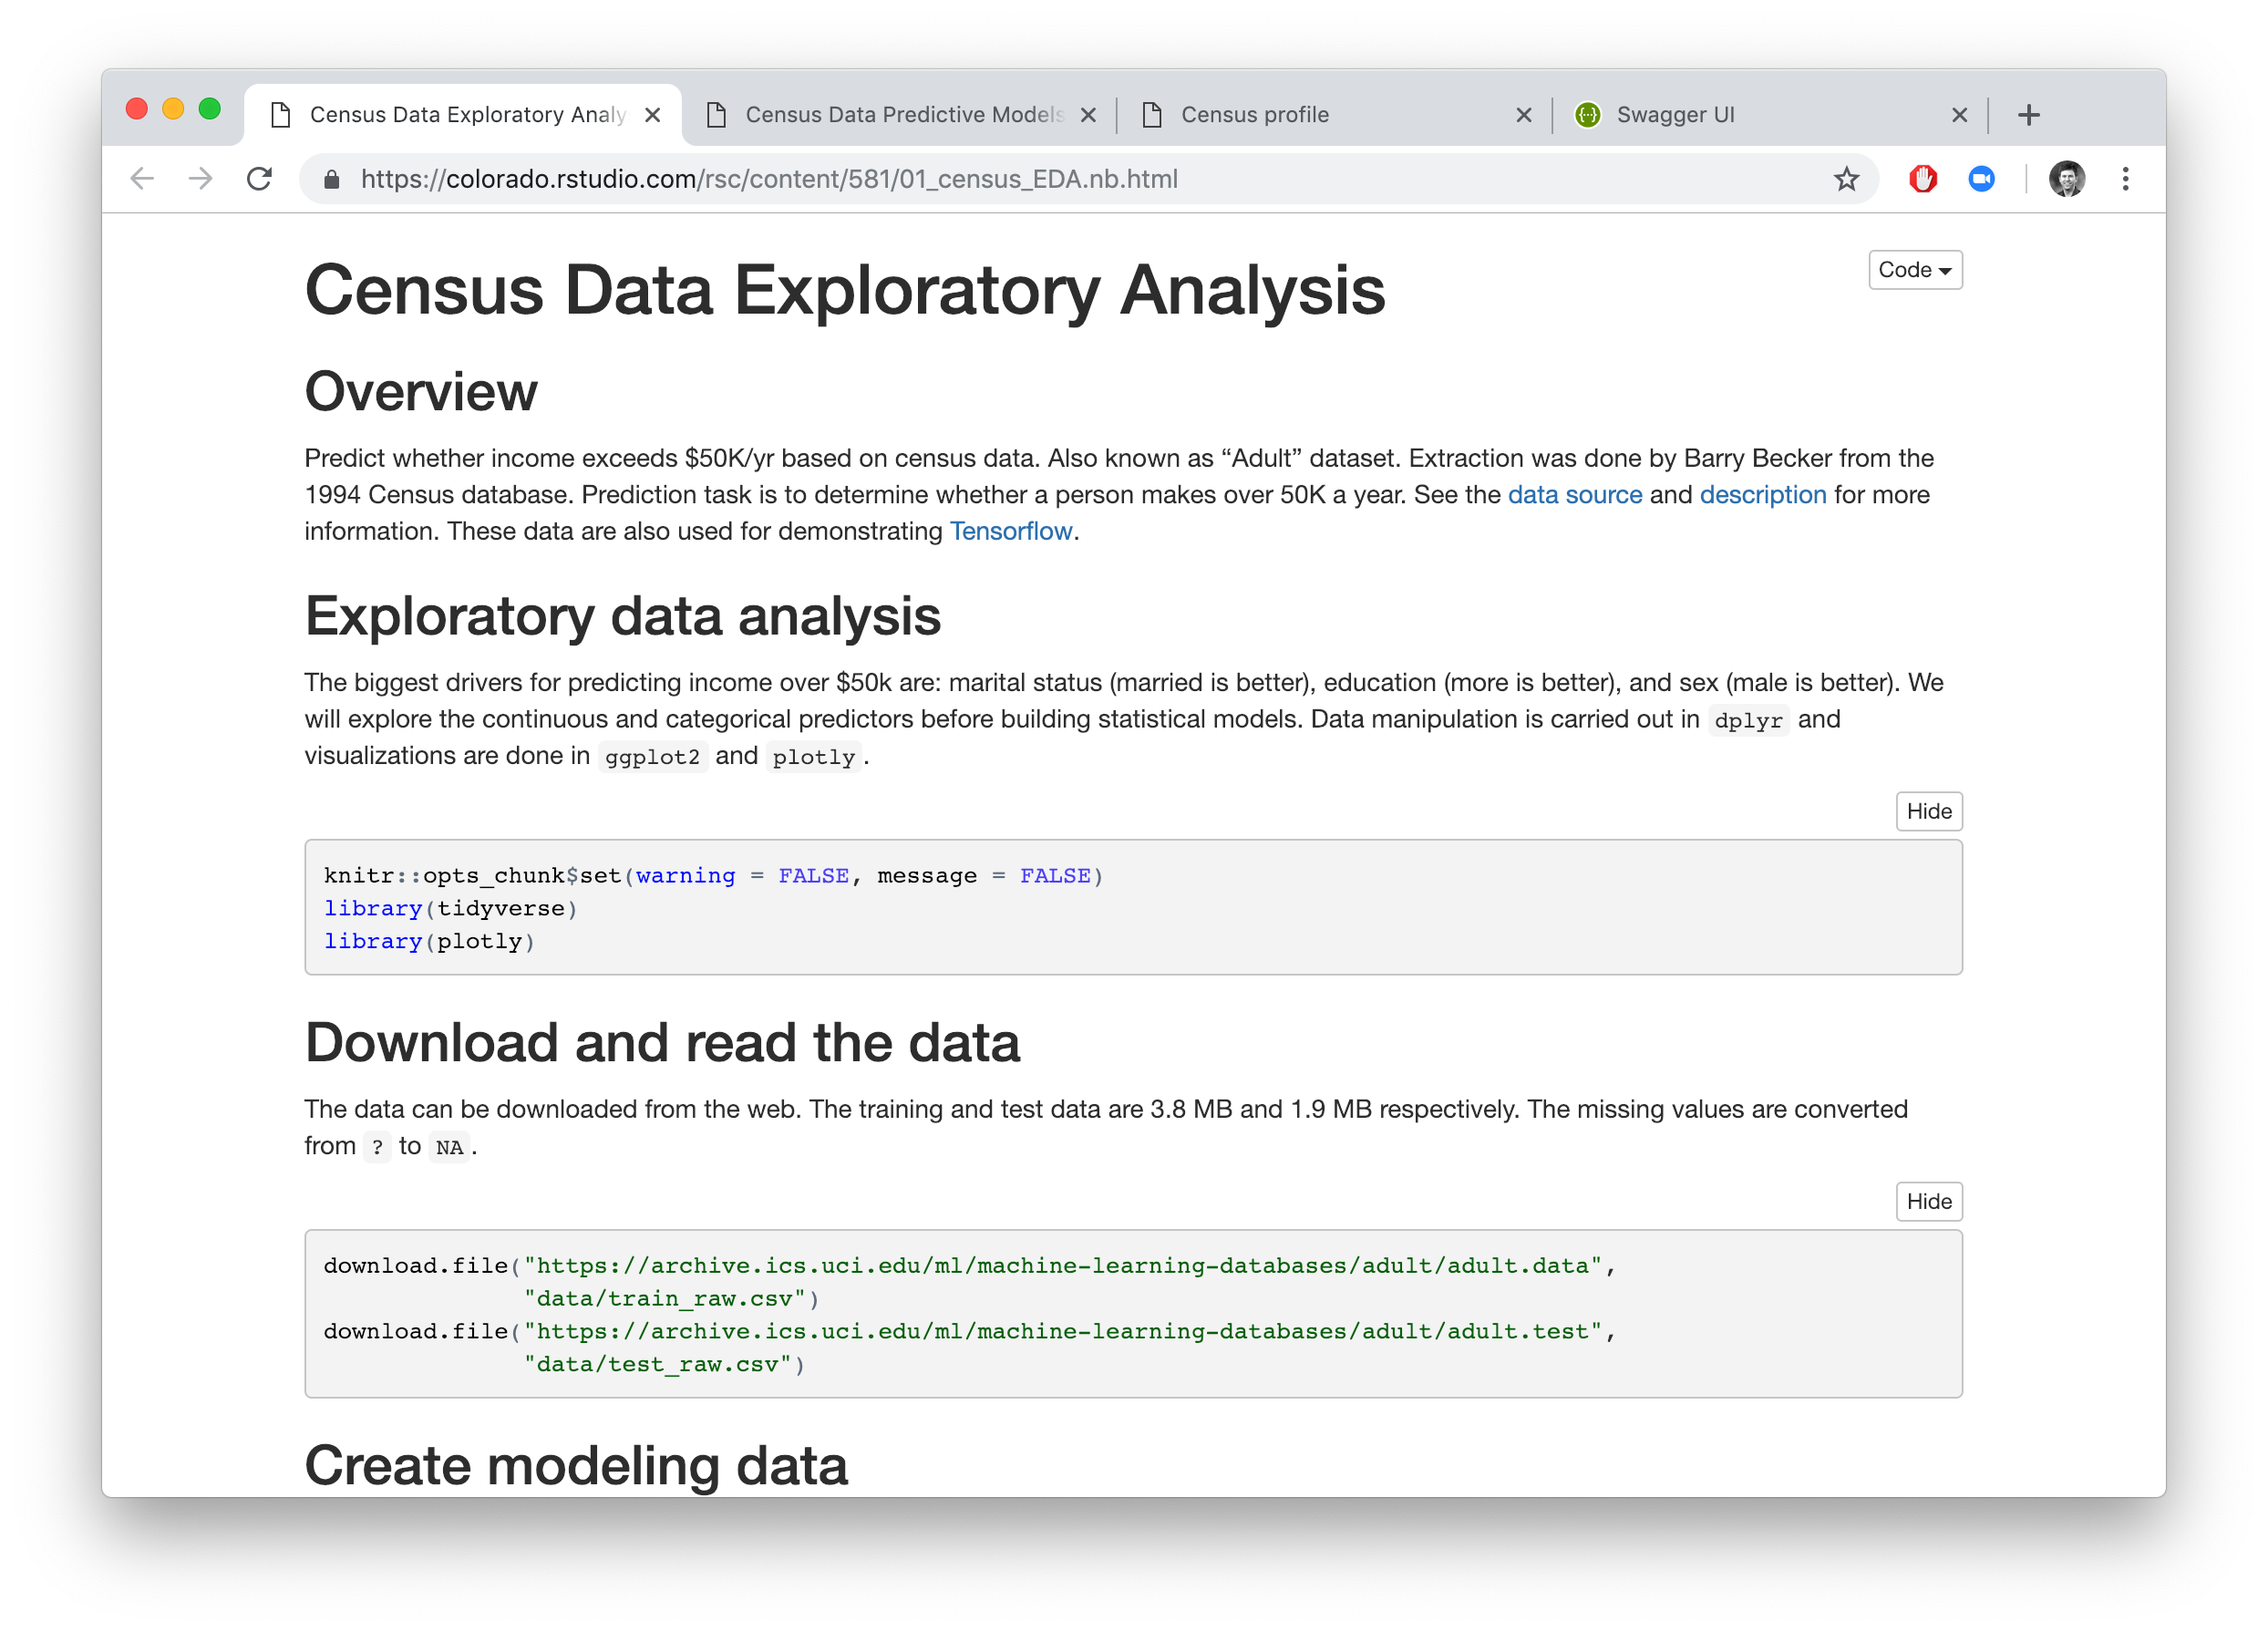
Explore the data
The first part of a data science project is importing and understanding data. Our task will be to try and predict whether an individual makes more than $50,000 / year. Use the tidyverse to import and explore the data. Use R Markdown Notebook mode to keep track of our code, narrative, and output in one place.
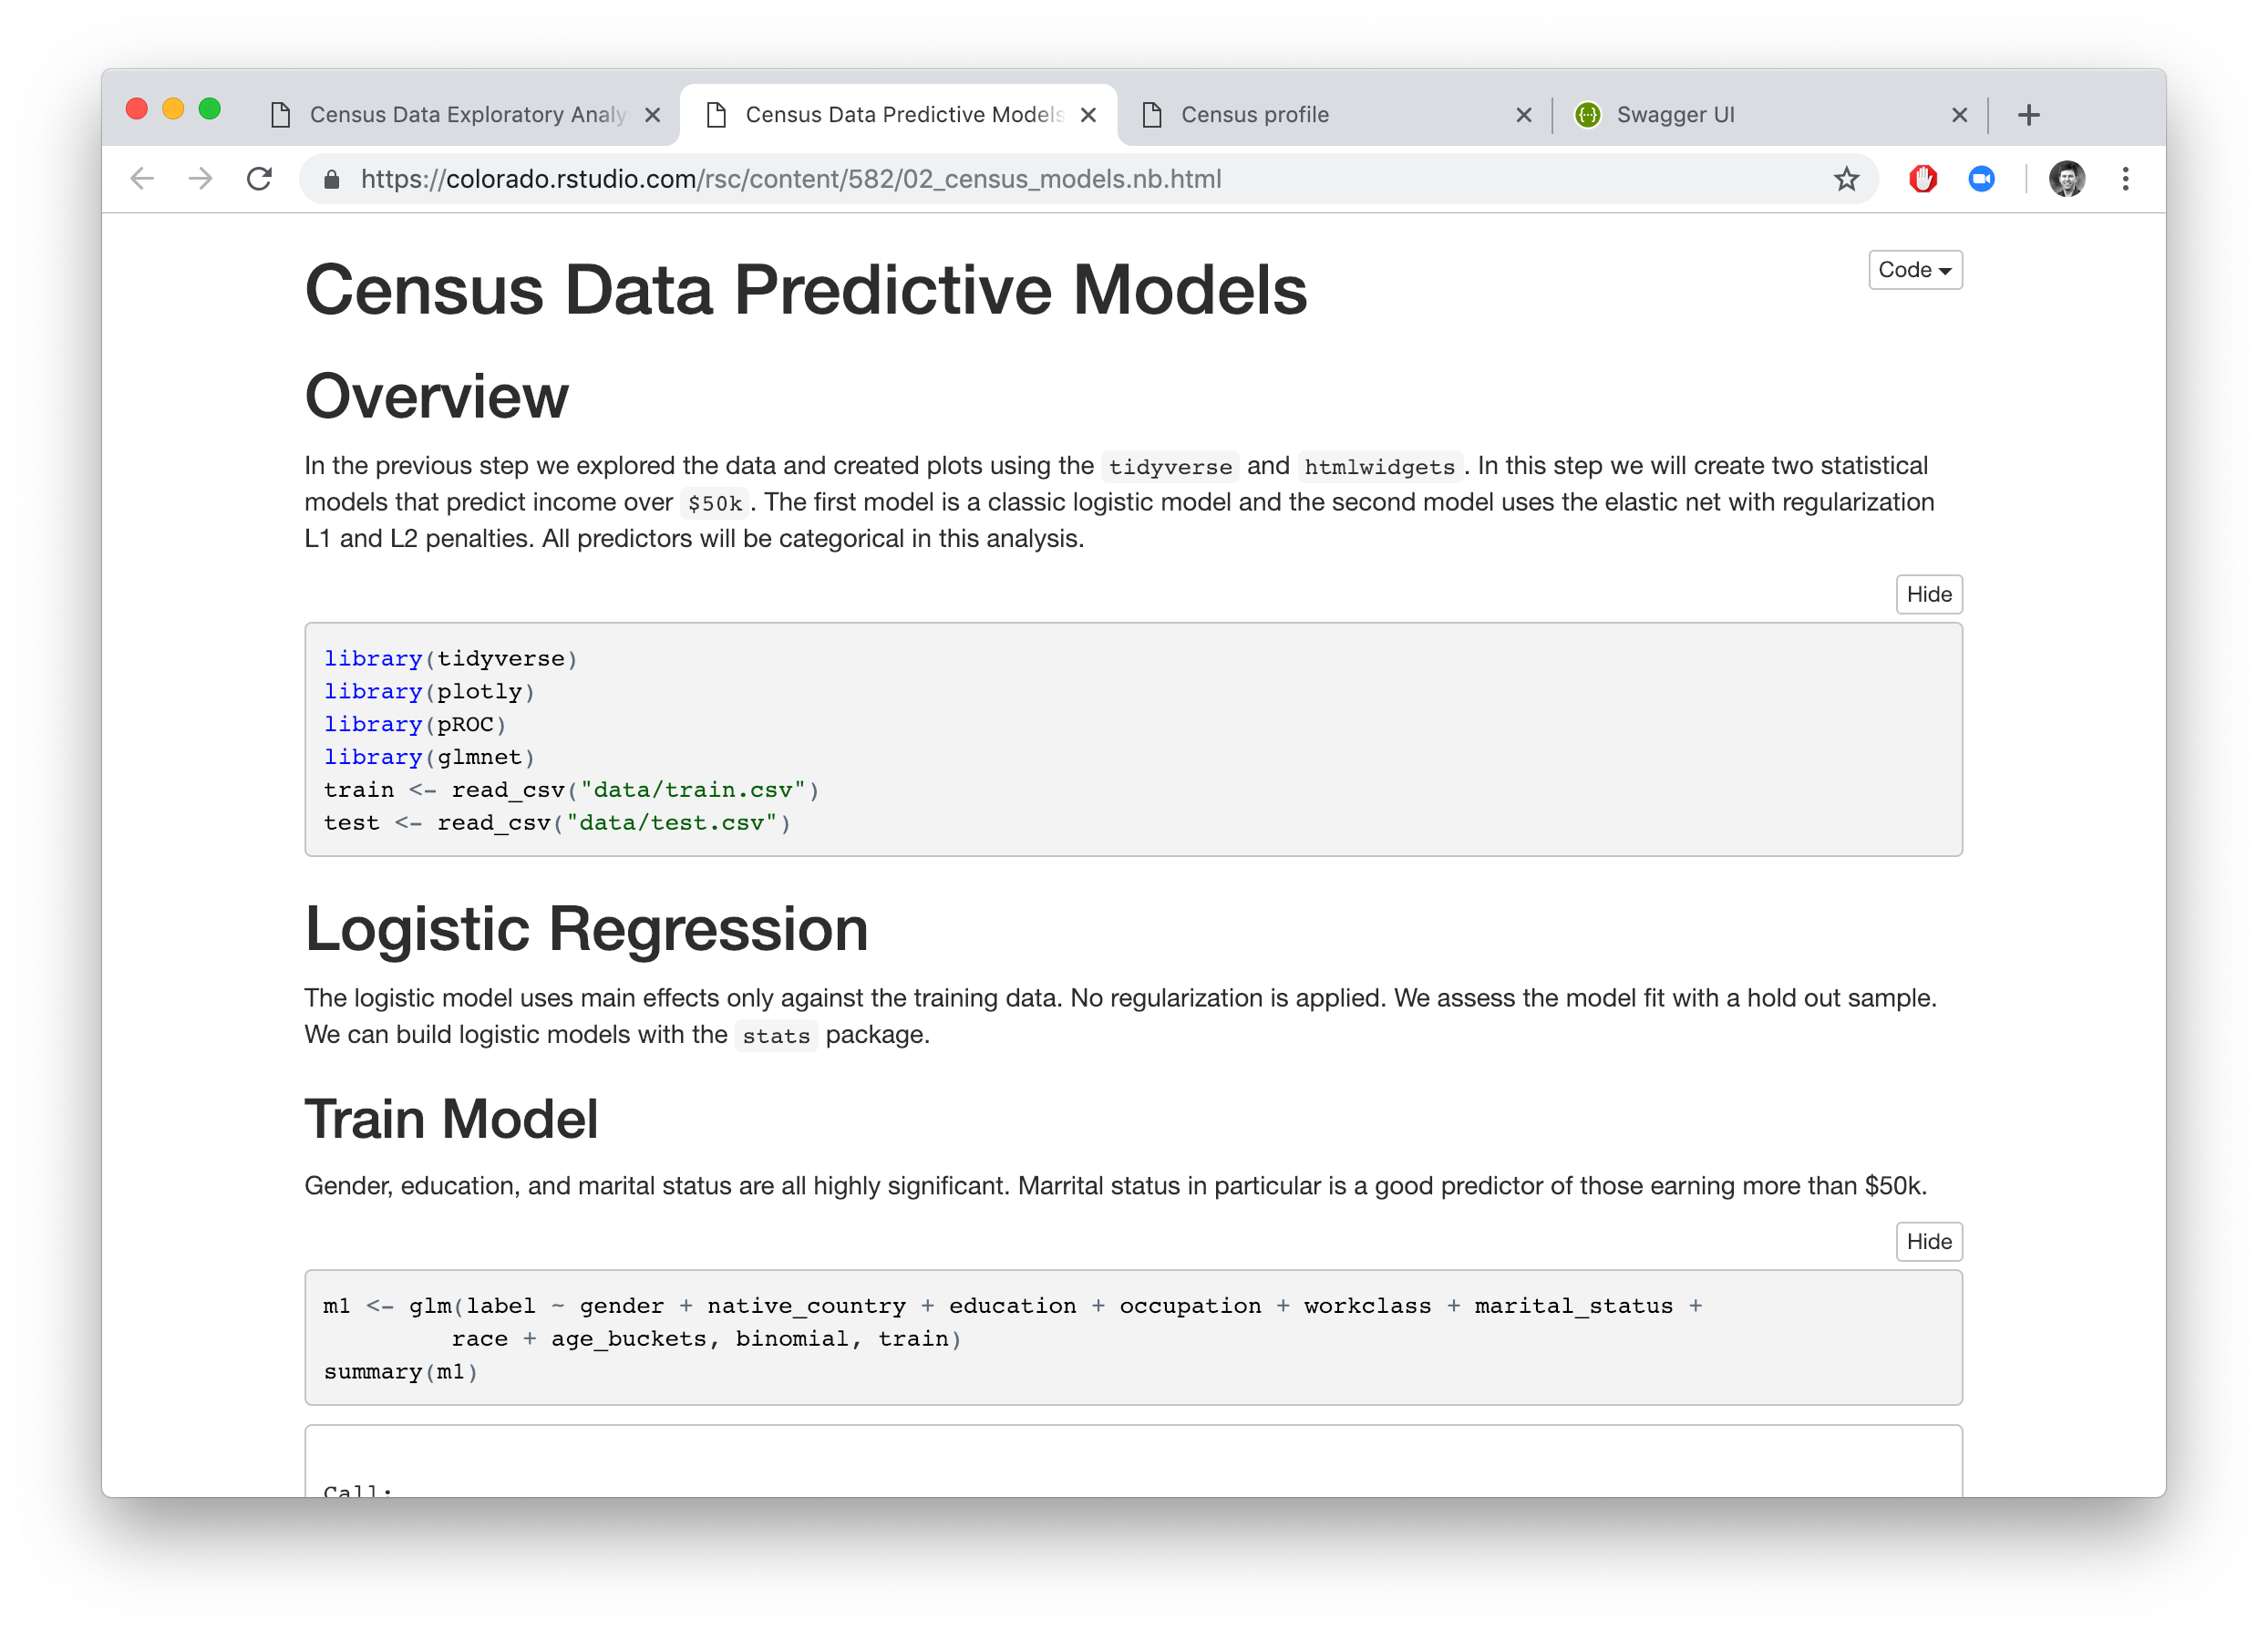
Train predictive models
Now that we have a tidy dataset we can train predictive models. This R Markdown notebook uses the glmnet package to fit a logistic model using elastic net regularization. One of the most powerful parts of R is the wide variety of modelling packages.
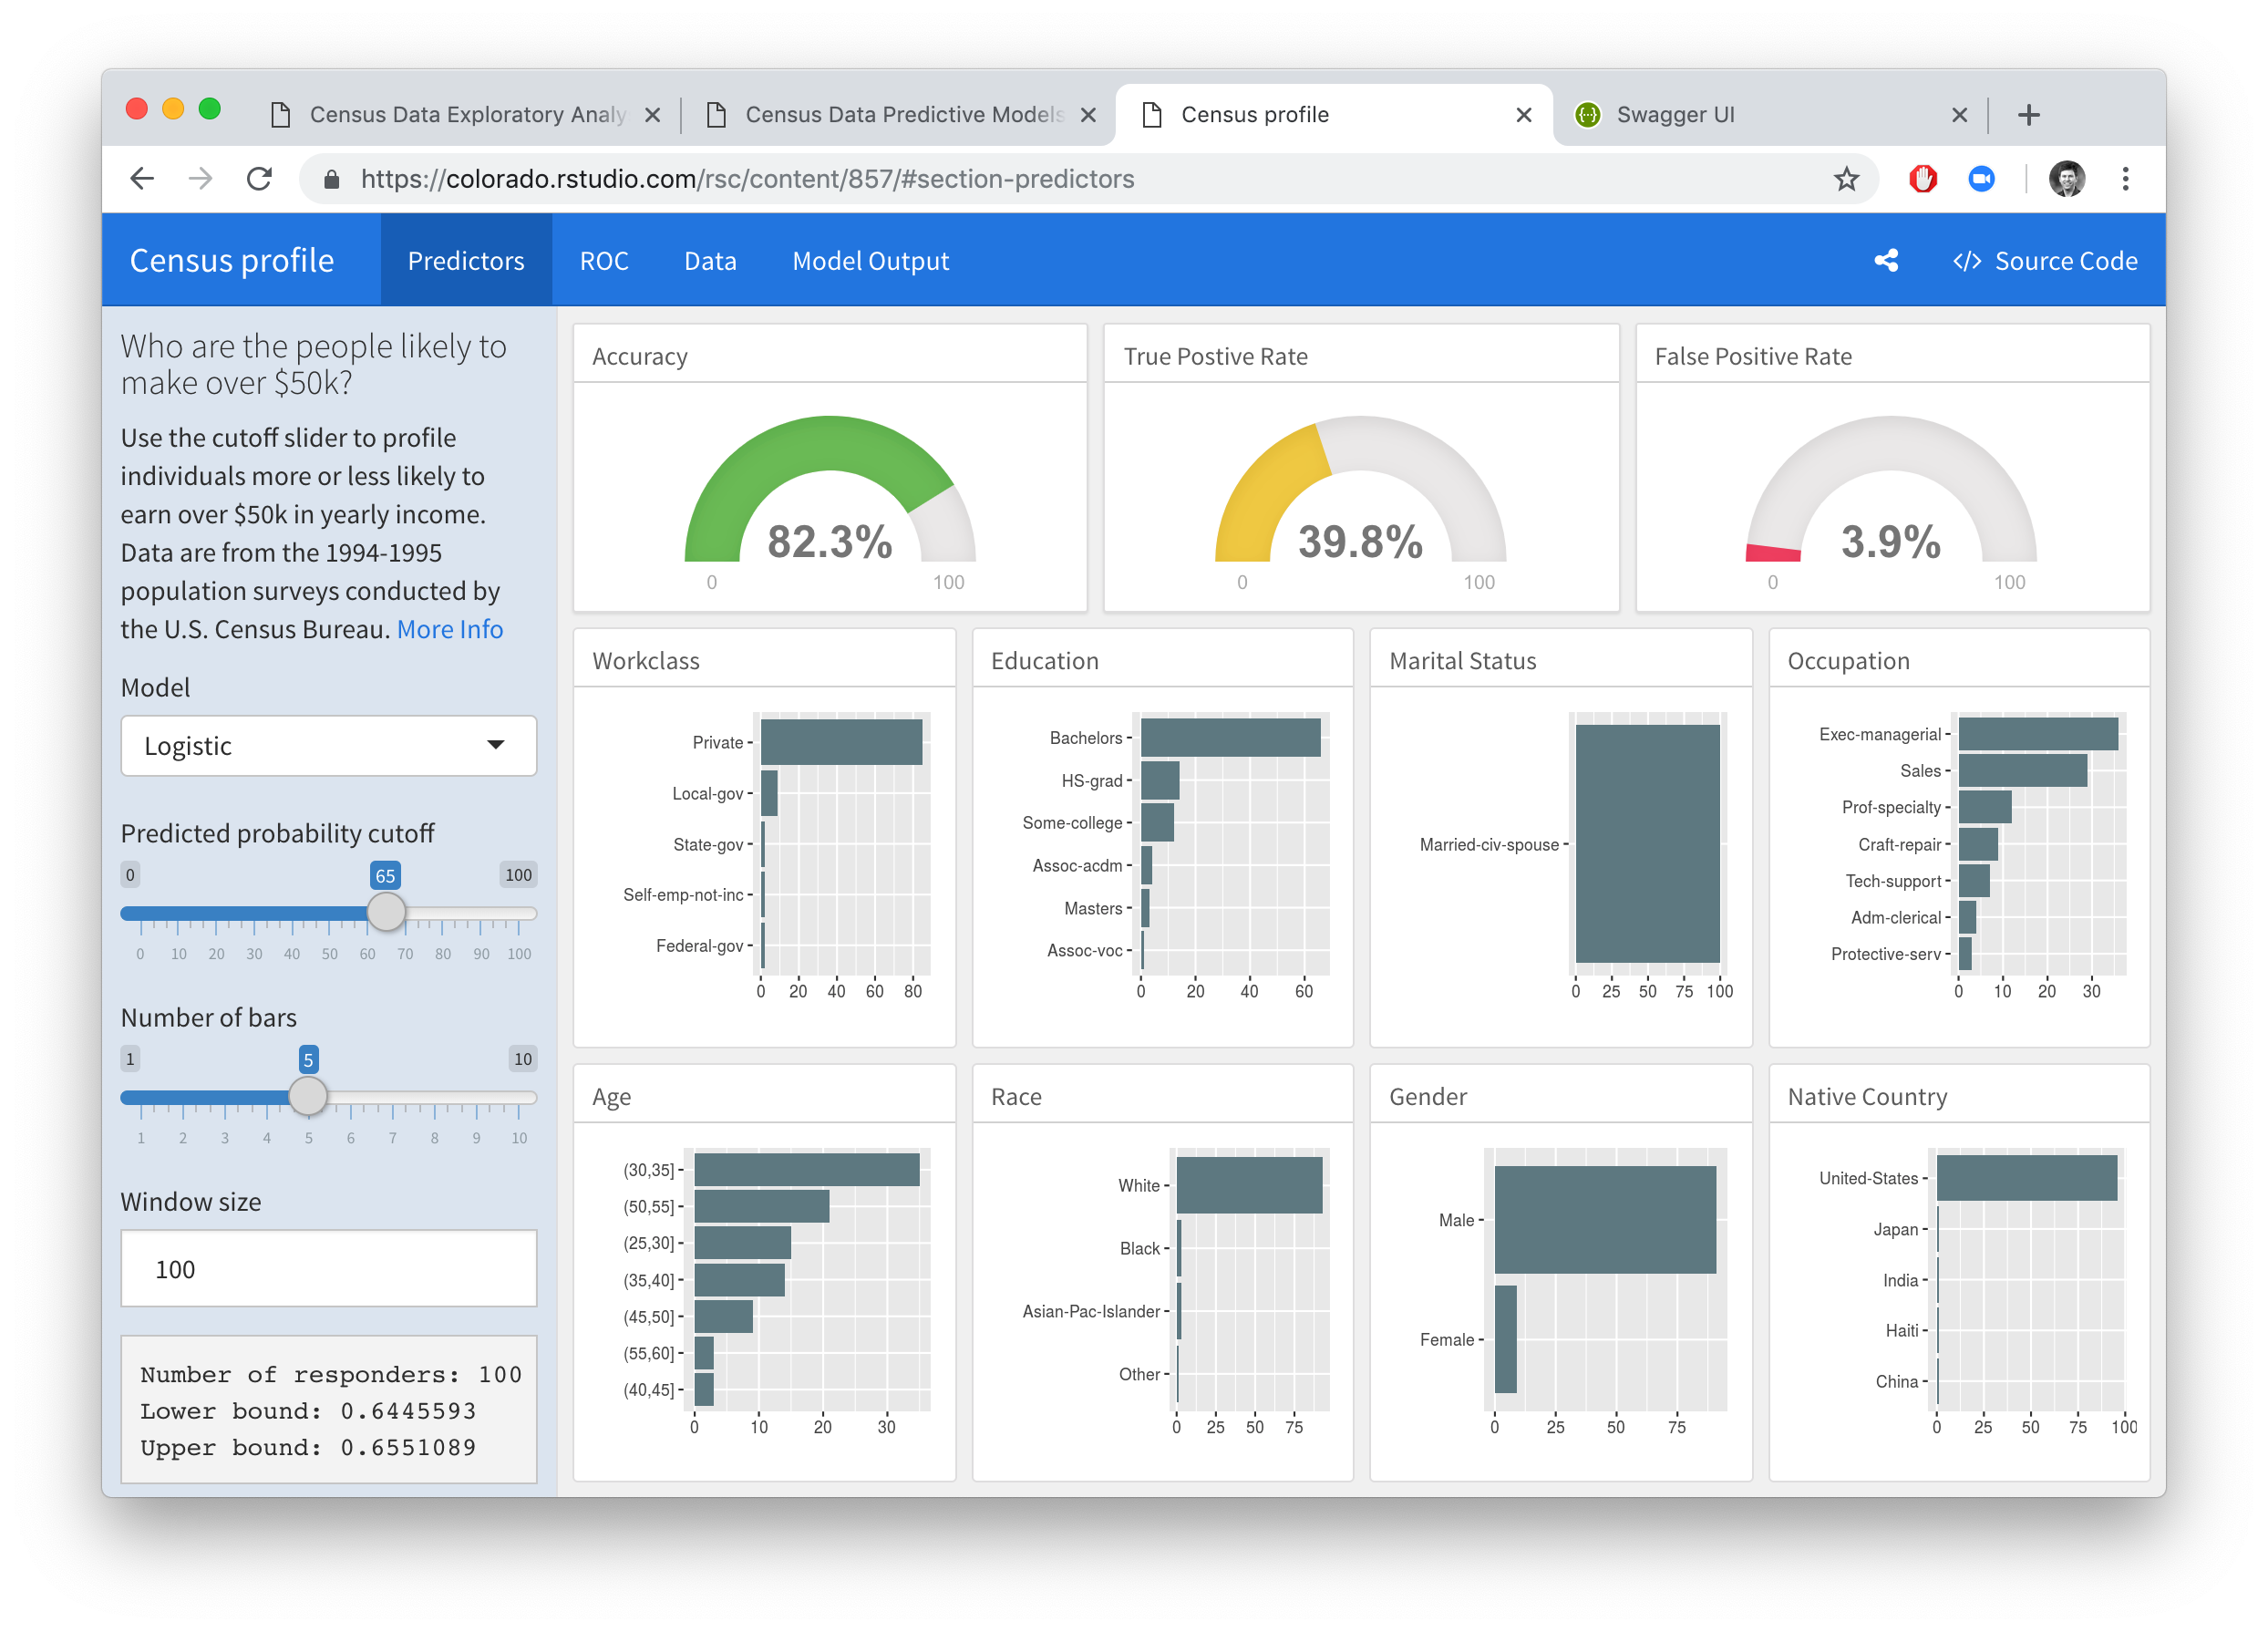
Deploy a dashboard
One way to quickly explore models is to use a Shiny application to expose model parameters as knobs and dials to tune. In this example we use a flexdashboard to change the cut-off value for our classification. By changing the cutoff and visualizing the predictors we can gain understanding about what predictors influence our classification decision.
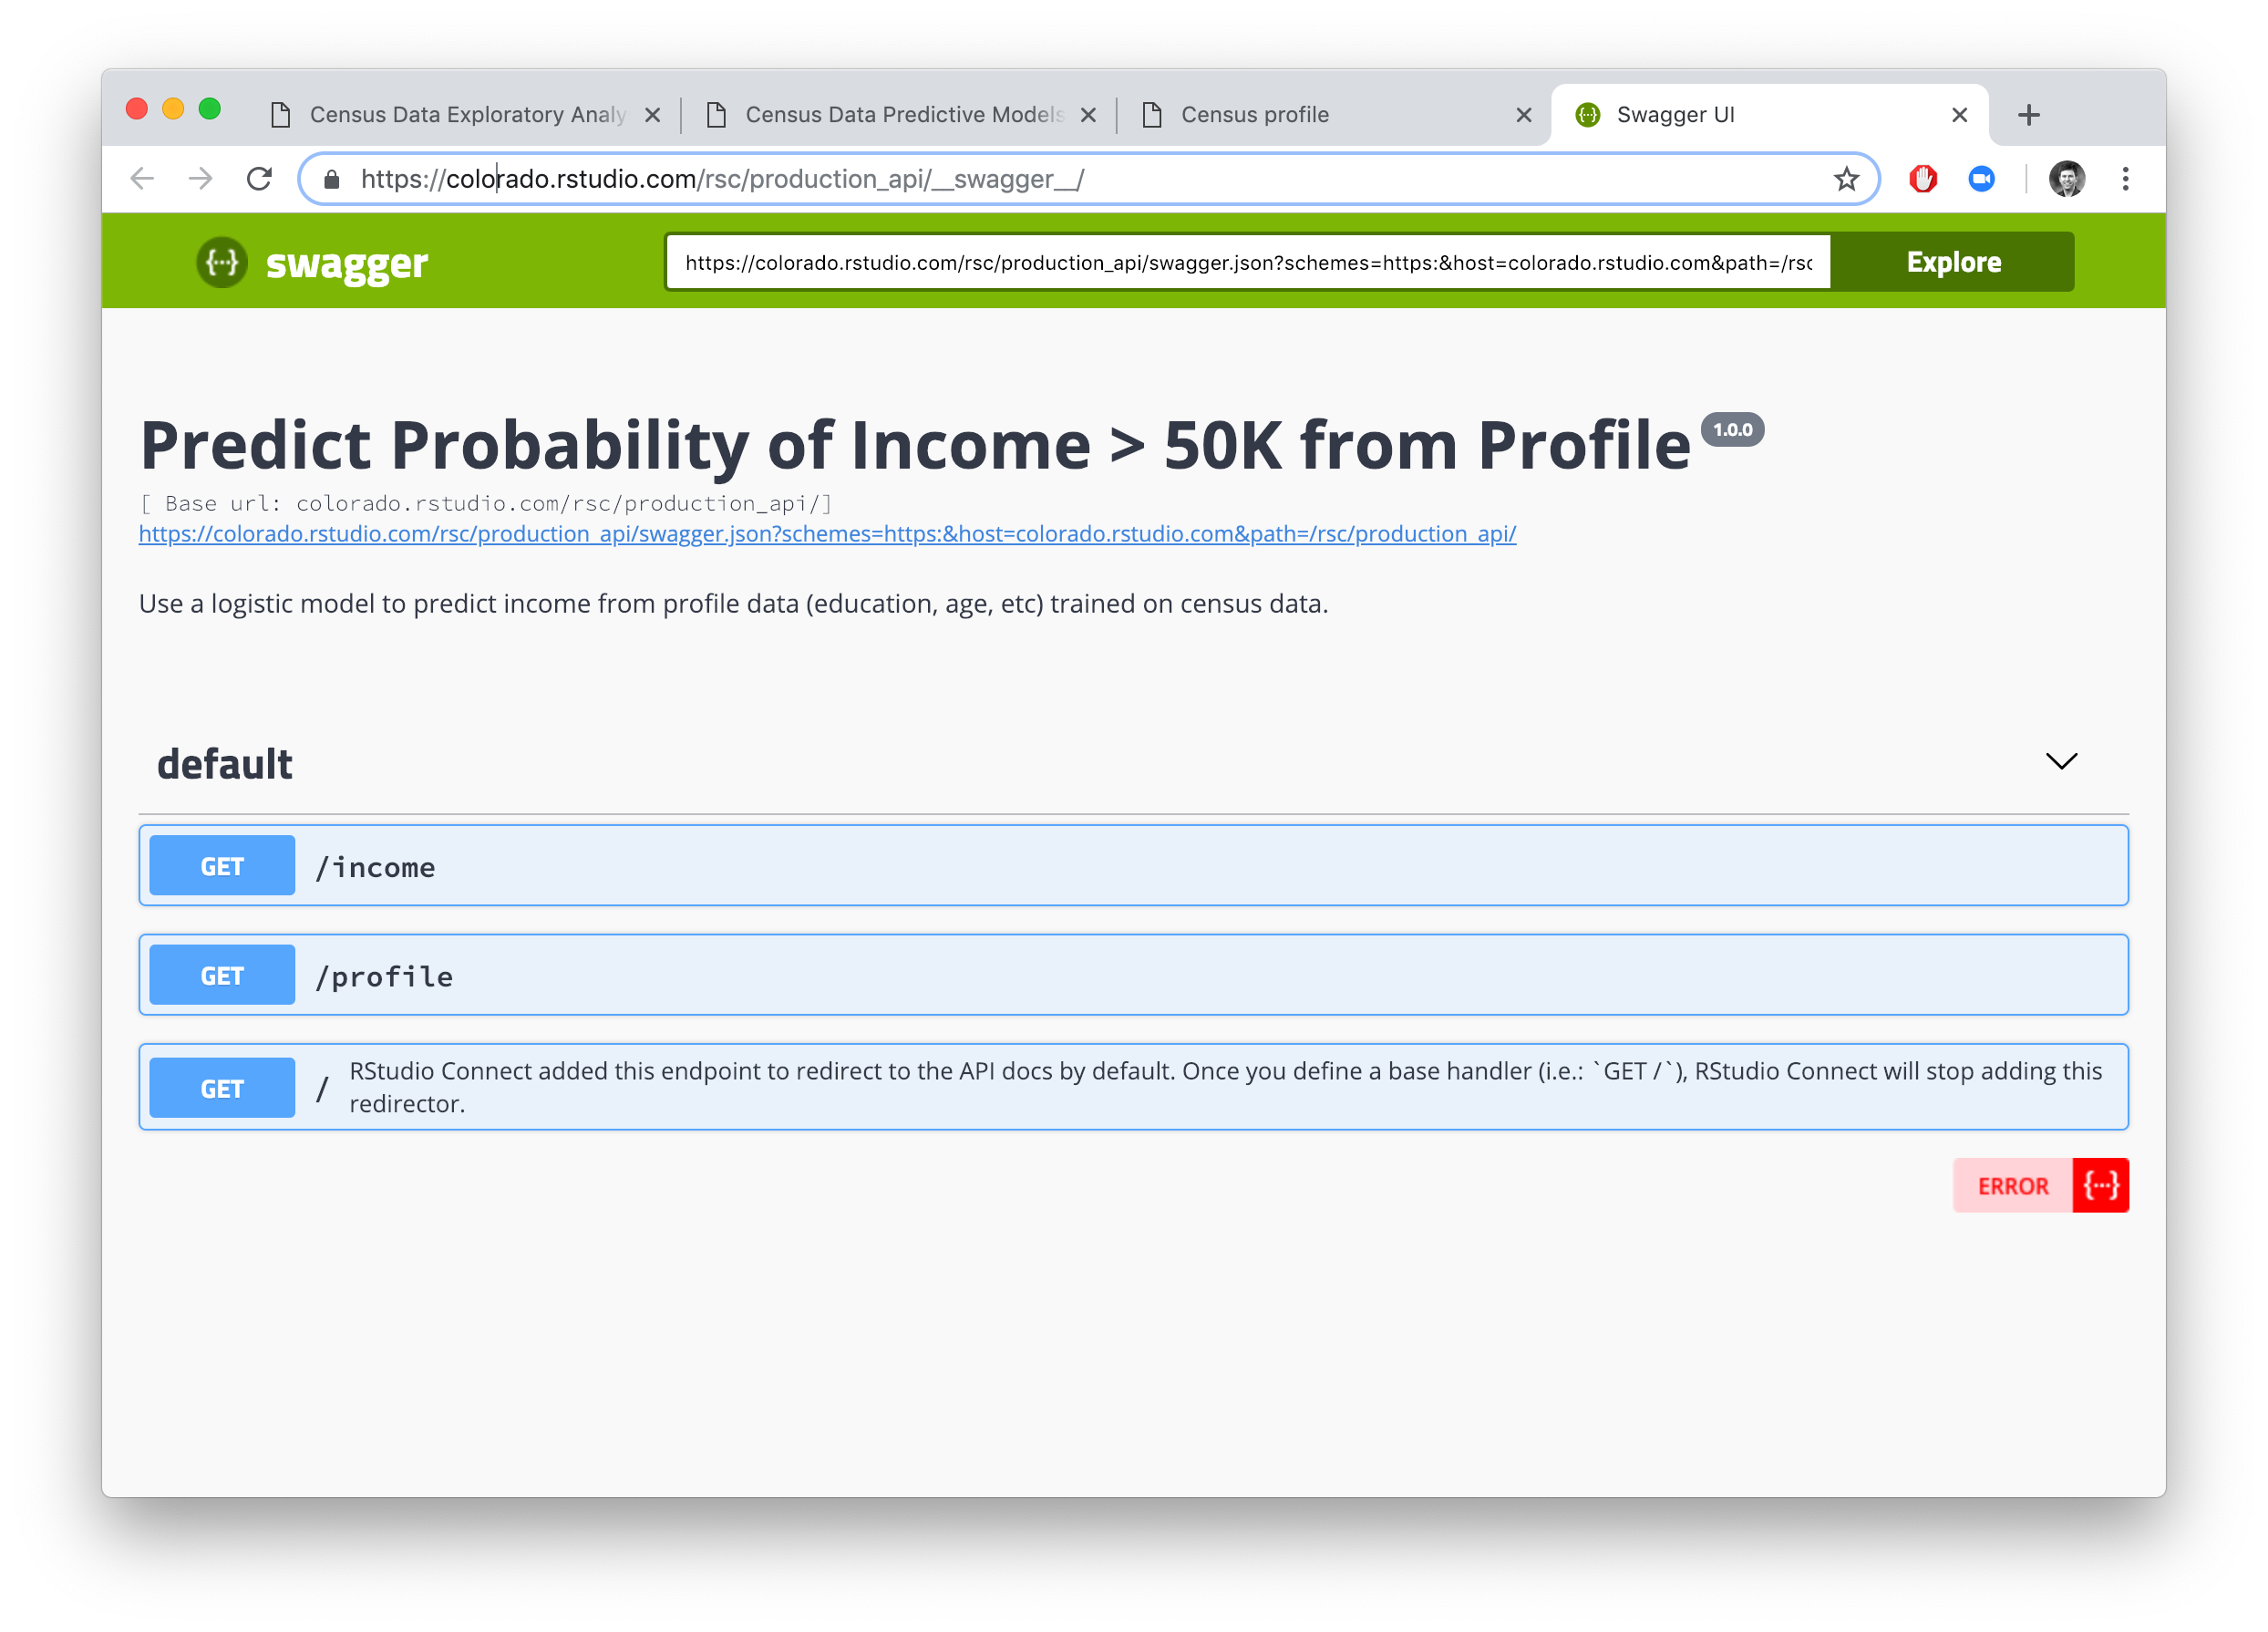
Build an API
What if you need to hand off your model predictions to another system? We can use plumber package to turn any R function into a REST API. These APIs can be used by external tools like production ETL processes, Java apps, web apps, or even Excel!